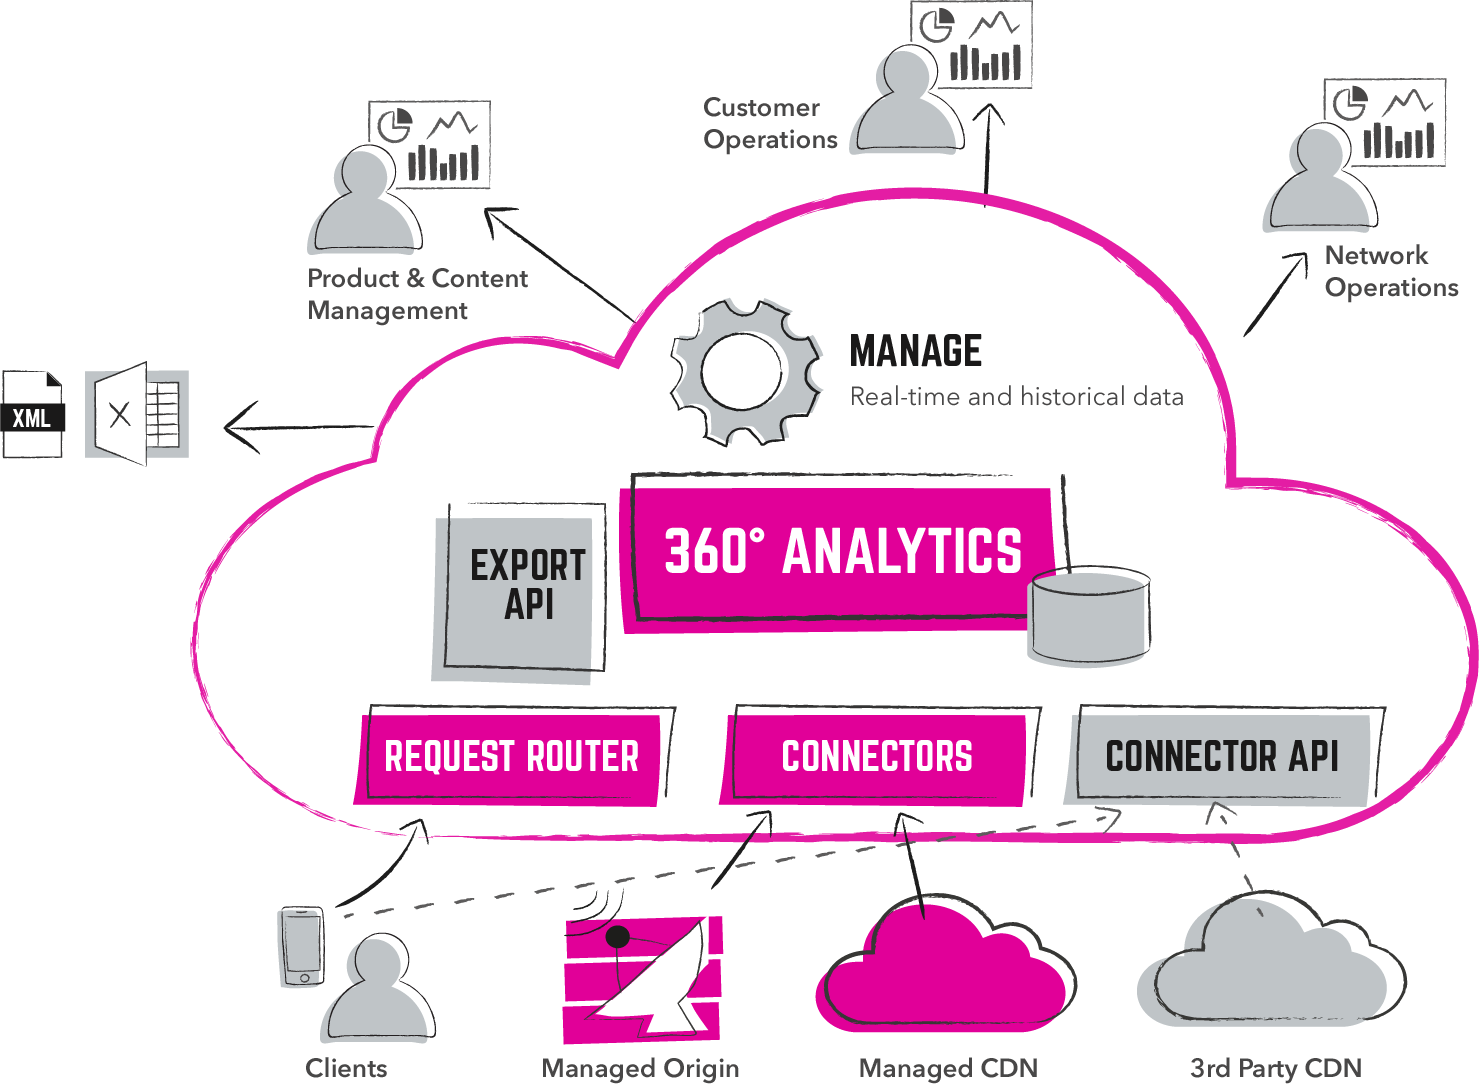
Monitor and analyze all aspects of your TV services, regardless of IPTV and OTT TV. Edgeware TV Analytics provides a single platform that ties viewer with network behavior, in real-time and over time, through aggregating data from various sources such as devices, network applications and integrated third party CDNs.
The ability to monitor and examine both viewer and quality analytics allows you to make advanced analysis, such as looking into the relationship between network performance and customer satisfaction, viewing behavior across geographies or screens, viewer mobility and screen swapping.
If you’re interested in TV analytics in a multi-CDN environment, then please see our StreamPilot delivery control platform. It provides real-time video QoE data and instant means to optimize the delivery path including CDN selection and switching.
Frontend TV analytics revolves around viewer behavior, providing insights such as most popular content, top streaming locations, asset engagement, session roaming.
Backend TV analytics look at operations and network performance, providing insights such as bandwidth consumption, bitrate per session, session quality.
Session roaming – Session management makes it possible to track client IP changes in the network, for example, when a viewer device moves from one network to another such as WiFi and 4G.
TV Analytics
WHAT IT DOES
- Single platform for viewer and network behavior analytics for both IPTV and OTT
- Multidimensionalanalysis via various filtering options – real-time and historical data with drill down capability (specific session, time, viewer, etc.)
- 3 out-of-the-box dashboards: Network Operations, Service Operations, Content & Viewers
- Easy integration through open REST HTTP API
- At least 35 pre-made widgets included
- Intuitive point-and-click visualization tool
- Fully customizable dashboards and widgets
- Aggregation of ABR log data into virtual sessions for efficient meaningful analysis
- Easy data or chart export and import via dashboard URL
- Multiple use cases – session roaming, content consumption patterns, ad insertion
TV Analytics
HOW IT WORKS

- Data is gathered from devices (e.g. device types, operating systems, browsers), Edgeware TV delivery products (origin and edge streaming applications), and other network sources (third party CDNs).
- Third party CDN data is then correlated with data gathered from managed sources in order to provide information about viewer behavior, a client session, network and delivery performance.
- Events or alarms can be configured so that whenever there are any delivery problems or bottlenecks based on a specified severity level, the session will be logged and network operators will be notified. E.g. a lost live feed (or other SLA breach) is treated as urgent by default.
- Pre-configured dashboards and widgets included contain drill down capability, export or import functions for further processing in Excel or other data processing tools, and can be fully personalized to reflect your objectives and KPIs.


TV Analytics
HOW TO DEPLOY
TV Analytics can be deployed on your standard COTS servers or in virtual environments such as VMWare.